Analytical report: Bali short-term rental market 2024–2025
In brief
Bali's total short-term rental market revenue grew 31.4% — to $792M in 2025. The number of active listings increased 35.9% (from 16,161 to 21,961 properties), while actual demand grew by more than 30%. The market has entered a mature phase: yield increasingly depends on a professional concept and the operational efficiency of a property, rather than on the overall market trend.
DTDmitrii Totoev, founder of BDAPublished: 2026Geography: Bali, Indonesia
The report draws on data from the AirDNA platform and covers short-term rental properties that meet the sample's selection criteria. The analysis includes only listings with an Availability Days value of at least 180 days.
The study focuses on the private short-term rental segment (villas and similar formats). Much of the hotel stock, along with apart-hotels and other accommodation types, falls outside the sample.
Sample parameters
Dataset formation criteria
Data sourceAirDNA
Listing filterAvailability Days ≥ 180 days
Segmentprivate villas and similar
Excluded from samplehotels, apart-hotels, etc.
Executive Summary
Key market takeaways
In 2024–2025, Bali's short-term rental market has moved into a more mature phase of development, marked by large-scale expansion and a qualitative transformation of supply. The headline indicators confirm the market's resilience and its ability to adapt to growing competition.
Scale and dynamics · 2025
The market is expanding in both volume and monetary terms
$792M
total revenue of Bali's short-term rental market
+31.4% YoY
21,961
active listings on the island (was 16,161)
+35.9% YoY
+30%
growth in the actual number of occupied properties — demand resilience
more than, over the year
+52%
revenue growth in the Bukit district — the most pronounced dynamics
local driver
Key investment takeaway. The market is becoming more demanding of property quality. In a mature market, yield increasingly depends on a professional concept and the operational efficiency of a property, rather than on the overall market trend.
Section 01
General overview of the Bali market
The report is based on an analysis of Bali's short-term rental market for 2024–2025 and reflects the key indicators that affect investment yield: supply volume (Listings), occupancy level (Occupancy) and total market revenue (Total Revenue).
Bali is one of the largest tourist markets in Southeast Asia and a key hub of international tourism in Indonesia. A steady flow of guests from Australia, Europe, the USA and Asia generates sustained demand for short-term rentals and underpins investment yield.
Expanding tourism infrastructure, better air connections and the popularity of the villa format have driven rapid growth in the short-term rental market. Today it is one of the most dynamic areas of real estate investment on the island.
Market scale · 2025
Key island indicators
21,961
listings 2025
supply growth +34%
$792M
market revenue
revenue growth +31%
Market Dynamics
Dynamics of supply and market revenue
Supply dynamics
Year
Cnt. listings
Change
2024
16,161
+35.9%
2025
21,961
The short-term rental market remains in a phase of active growth. Over the year, the number of listings increased by 35.9%. The growth in supply reflects a strong inflow of investment and the active launch of new development projects. The rising number of properties raises the bar for the quality of new projects and the level of their market positioning.
Total market revenue
Year
Total Revenue
Change
2024
$602M
+31.4%
2025
$792M
Total market volume is growing too, up 31.4% over the year. That growth comes both from the rising number of properties and from more guests. At the same time, supply is growing faster than revenue, which means yield increasingly depends on the quality of the project and the level of management.
Key observation. Supply is growing faster than revenue (+36% vs +31%), which points to intensifying competition and rising quality requirements for properties in order to secure high yield.
Geographic Distribution
Distribution of supply by district (2025)
A significant share of supply is concentrated in a few key tourist districts. The largest accommodation clusters are Canggu (22%), Bukit (16%) and Ubud (14%). Together these districts account for around 52% of all short-term rental supply on the island.
District shares of island supply
Bali Total — 21,961 listings (2025)
21,961
listings
Canggu · 4,74622%
Bukit · 3,59316%
Ubud · 3,02014%
Other districts · 10,60248%
Section 02 · Bukit district
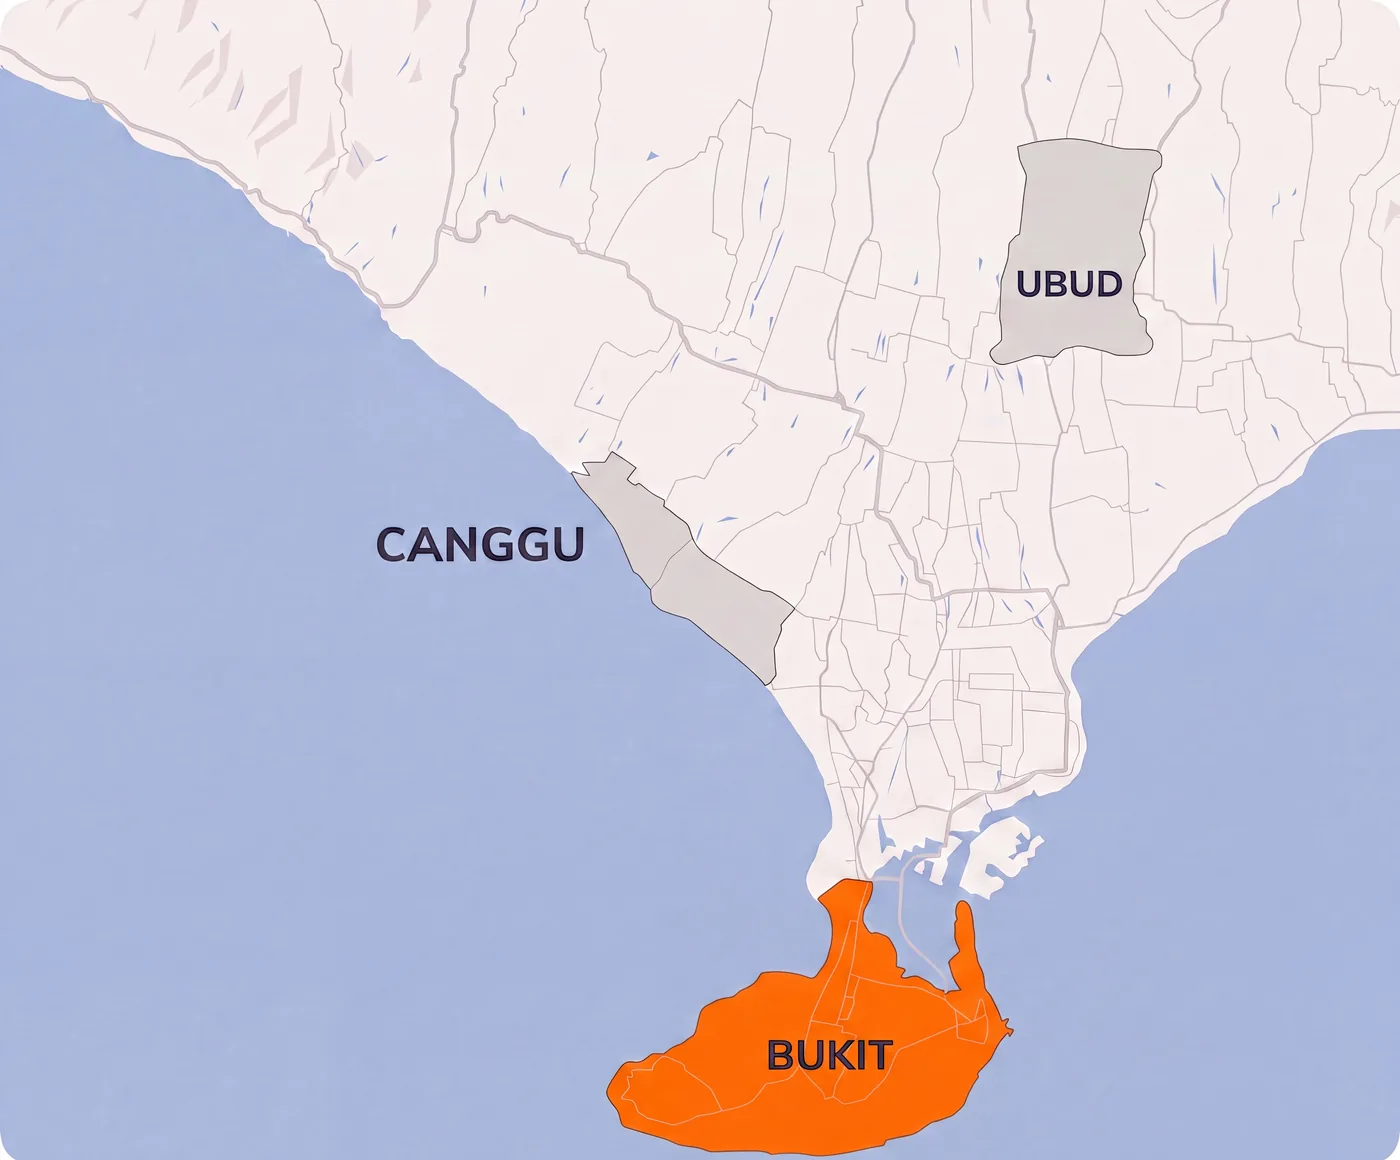
Bukit — overview and supply growth
The island's macro indicators reveal uneven growth across key locations. In the current cycle, the most pronounced momentum is concentrated in the south, where Bukit stands out as one of the main hubs of investment activity.
Bukit is one of the fastest-growing tourist districts in the southern part of Bali. The area is known for its cliffs, popular surf beaches and well-developed dining infrastructure. Thanks to the combination of natural landscapes and a modern tourist environment, the district has become one of the core locations for short-term rental investment.
In recent years, Bukit has been actively developed with new villas and boutique hotels. The growth of beach clubs, restaurants and service infrastructure has led to a steady increase in the flow of tourists, which simultaneously strengthens its investment appeal and the level of competition between properties.
Bukit — Bali's southern peninsula: cliffs, surf beaches and a fast-growing rental market
2.1. Supply growth in the Bukit district
Year
1br
2br
3br
4br
5br
6br+
All
2024
547
747
581
254
85
105
2,319
2025
963
1,223
837
336
112
122
3,593
Change
76.1%
63.7%
44.1%
32.3%
31.8%
16.2%
+54.9%
Amid the district's rising popularity, supply grew by roughly 55%. Over the past year, the number of active listings increased from 2,319 to 3,593 properties.
Most of the increase comes from new development projects aimed at short-term rentals. Modern villas make up a large share of the new supply, gradually shifting the mix toward newer, more competitive projects.
This also increases supply density within the segment and raises the quality requirements for new projects.
2.2. Occupancy in the Bukit district
Year
1br
2br
3br
4br
5br
6br+
All
2024
74.5%
73.1%
68.3%
61.8%
59.7%
49.9%
64.5%
2025
70.2%
68.3%
60.9%
58.7%
55.4%
44.4%
59.7%
Change
−4.3%
−4.7%
−7.4%
−3.1%
−4.3%
−5.5%
−4.9%
Despite the significant growth in supply, the occupancy level (Occupancy) declined moderately — by around 5 percentage points. The average figure fell from 64.5% in 2024 to 59.7% in 2025, which is a relatively moderate change given that the number of properties grew by almost 55%.
This pattern shows that supply growth is matched by rising tourist demand, which supports the market's expansion and partially absorbs the new properties. At the same time, the decline in occupancy reflects gradually intensifying competition within the district and rising quality requirements for properties.
2.3. Demand dynamics
Year
1br
2br
3br
4br
5br
6br+
All
2024
408
546
397
157
51
52
1,610
2025
676
836
510
197
62
54
2,336
Change
66.0%
53.2%
28.5%
25.8%
22.2%
3.4%
+45.0%
The actual number of properties hosting guests increased by more than 45% — from 1,610 in 2024 to 2,336 in 2025. This reflects real growth in the flow of tourists and an increase in the volume of guest accommodation in the Bukit district.
So even as supply expands, the market keeps posting real demand growth, confirming a steady increase in stays across the district.
2.4. Market revenue in the Bukit district
Unit Type
2024
2025
Change
1br
$13.1M
$23.1M
76.3%
2br
$20.6M
$35.0M
69.8%
3br
$24.3M
$35.9M
47.9%
4br
$14.3M
$22.0M
53.7%
5br
$7.7M
$9.3M
20.7%
6br+
$12.5M
$15.2M
21.5%
Total
$92.6M
$140.6M
+51.8%
Bukit district revenue
USD million · 2024 → 2025
$92.6
2024
$140.6
2025
Revenue
+51.8%
the island's strongest growth
Occupancy
−4.9 pp
moderate correction
Short-term rental revenue in Bukit continues to grow rapidly. Total market volume rose from around $92.6M in 2024 to $140.6M in 2025 — growth of roughly 51.8%. Bukit is therefore adding not just properties but turnover, confirming rising tourist spending and economic activity across the segment. Against a backdrop of rapid supply expansion, it also raises the bar for property quality, concept and management.
2.5. Investment takeaway
Bukit shows the most pronounced dynamics among all the island's districts: revenue grew 51.8% with a moderate occupancy decline of just 5 pp. The market is expanding actively, the flow of tourists is growing, and demand continues to absorb new properties.
At the same time, Bukit is not a single market but several locations with fundamentally different investment logic. Some have already passed the peak of affordability and operate under intense competition. Others are only just building their infrastructure and offer an earlier entry point with high growth potential.
The district's average figures do not reflect this difference. The investment outcome in Bukit is determined not by the district as a whole but by the precision of the location choice within it.
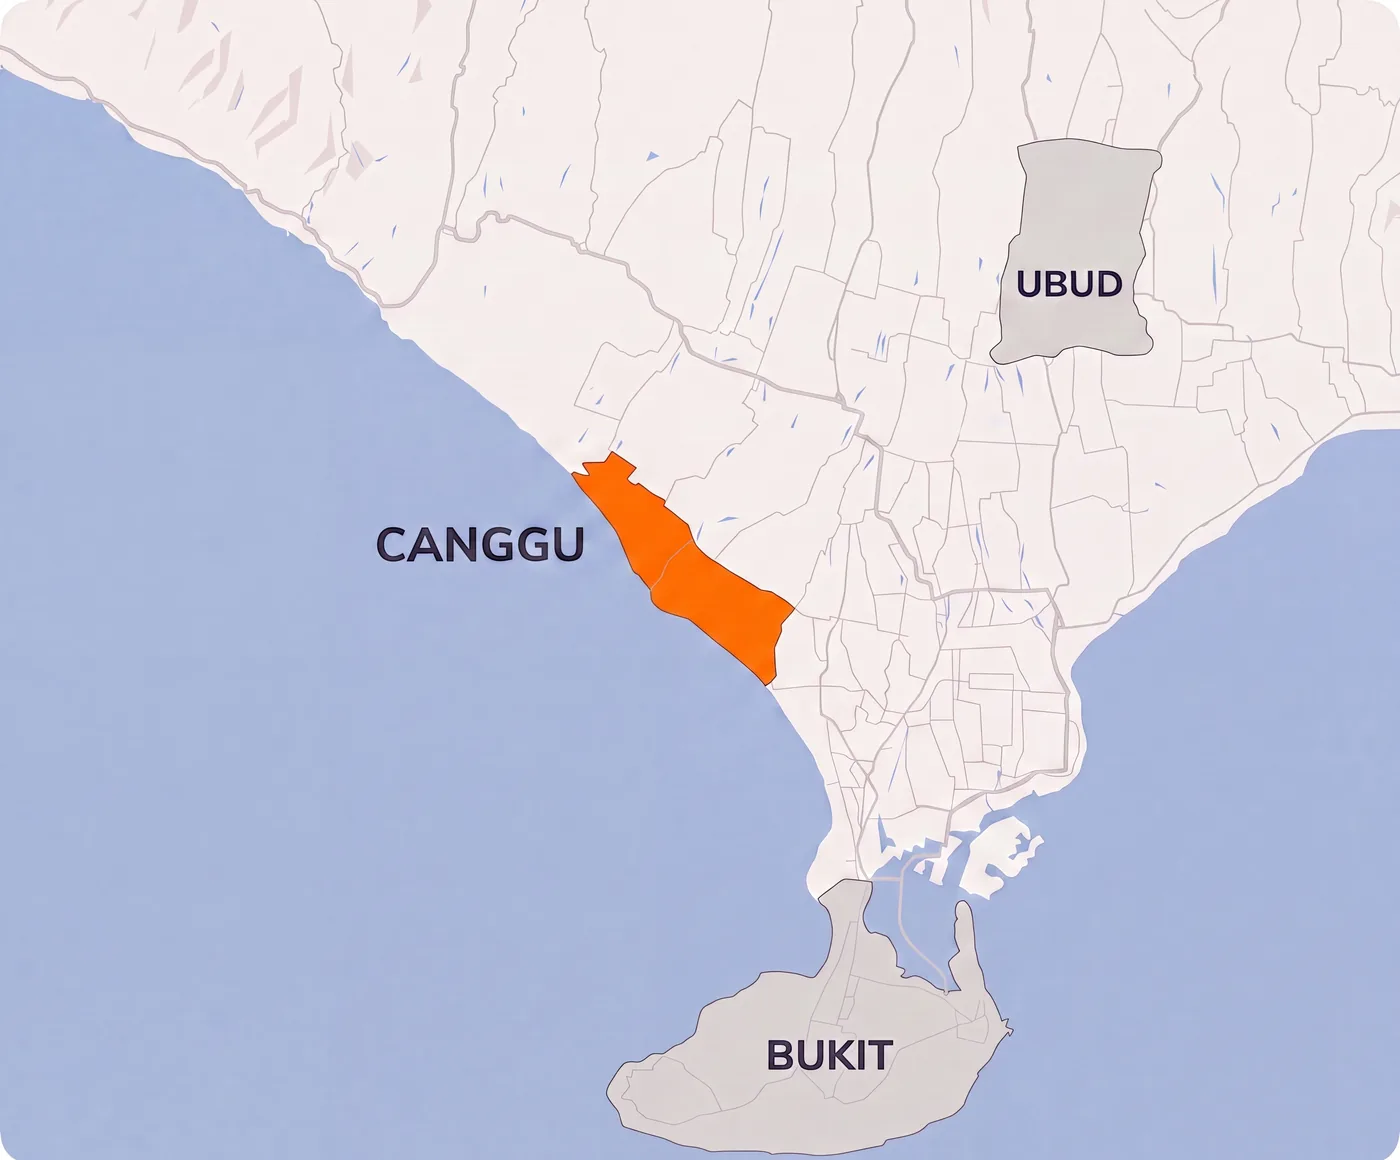
Canggu — an expanded coastal cluster from Umalas to Nuanu
While Bukit is still busy building out its infrastructure, Canggu is a more consolidated market, where the emphasis shifts from sheer volume growth toward holding quality metrics and cultivating a lifestyle environment.
Canggu is one of the most urbanized and dynamically developing districts of Bali. For the purposes of this report, the Canggu district includes an expanded cluster of locations — from Umalas to Nuanu — which allows a fuller reflection of actual market activity in this part of the island. Unlike classic resort locations, Canggu has developed as a hub of the island's modern expat and tourist life, which generates steady rental demand throughout the year.
The high concentration of infrastructure makes demand more stable compared to classic resort locations. New development projects are being actively delivered in the district, which simultaneously expands the market and intensifies competition in the segment.
3.1. Supply growth in the Canggu district
Year
1br
2br
3br
4br
5br
6br+
All
2024
691
1,040
1,087
380
178
208
3,584
2025
931
1,447
1,433
483
210
242
4,746
Change
34.7%
39.1%
31.8%
27.1%
18.0%
16.4%
+32.4%
The number of active listings grew by roughly 32.4% — from 3,584 in 2024 to 4,746 in 2025. The most notable growth is seen in the 1–3 bedroom segments, which make up the bulk of supply and remain the most competitive segment of the market. The growth in supply reflects investors' continued interest in the Canggu district and the high activity of new development projects.
3.2. Occupancy in the Canggu district
Year
1br
2br
3br
4br
5br
6br+
All
2024
70.6%
73.7%
69.6%
66.5%
60.7%
56.8%
66.3%
2025
67.0%
68.1%
65.1%
61.2%
56.0%
53.3%
61.8%
Change
−3.5%
−5.6%
−4.6%
−5.3%
−4.7%
−3.5%
−4.5%
The Occupancy figure declined by 4.5 percentage points — from 66.3% in 2024 to 61.8% in 2025.
This dynamic points to the district's high resilience: the increase in the number of properties is accompanied by rising tourist demand that supports the expansion of supply.
Even with the market growing by more than 32%, occupancy remains at a high level, which confirms the stability of demand in the district.
3.3. Actually occupied properties in the Canggu district
Year
1br
2br
3br
4br
5br
6br+
All
2024
488
767
757
253
108
118
2,490
2025
624
985
932
296
118
129
3,084
Change
28.0%
28.6%
23.2%
17.0%
8.9%
9.3%
+23.9%
The actual number of occupied properties increased by roughly 23.9% — from 2,490 to 3,084 properties.
This confirms steady growth in the flow of tourists even amid expanding supply and shows that demand continues to support market development in the Canggu district.
3.4. Market revenue in the Canggu district
Unit Type
2024
2025
Change
1br
$14.5M
$20.9M
44.0%
2br
$30.5M
$42.1M
37.9%
3br
$42.9M
$57.5M
33.9%
4br
$21.8M
$27.5M
26.1%
5br
$17.2M
$18.7M
9.1%
6br+
$18.4M
$27.9M
51.5%
Total
$145.4M
$194.6M
+33.9%
Canggu district revenue
USD million · 2024 → 2025 · the island's largest market
$145.4
2024
$194.6
2025
Revenue
+33.9%
the island's highest revenue
Occupancy
−4.5 pp
high resilience
Total market revenue in the Canggu district grew by 33.9%. In 2024 the total market volume was around $145.4M, and in 2025 it reached $194.6M. The largest contribution to revenue comes from 2–3 bedroom properties, which remain the most sought-after and, at the same time, the most competitive segment. The growth in total revenue confirms the district's high business activity and steady tourist demand.
3.5. Investment takeaway
Canggu remains the largest and most recognizable short-term rental market in Bali — $194.6M in revenue and stable occupancy at 61.8% confirm the resilience of demand. The district is established, its infrastructure is developed, and the flow of tourists is predictable.
However, it is precisely this maturity that defines the main constraint for an investor. The strong interest in the district over recent years has led to a substantial rise in entry cost — both for land and for finished properties. At current prices, the ratio of investment to potential yield is becoming less and less attractive.
Canggu is a district that has already worked through its investment window. Those who entered earlier have locked in their returns. For a new investor it is a market of stable cash flow, not capital growth.
Unlike the coastal clusters of the south, the island's interior — represented by Ubud — forms an alternative demand vector geared toward cultural and wellness tourism. This shapes both the structure of supply and the pace at which the market absorbs new properties.
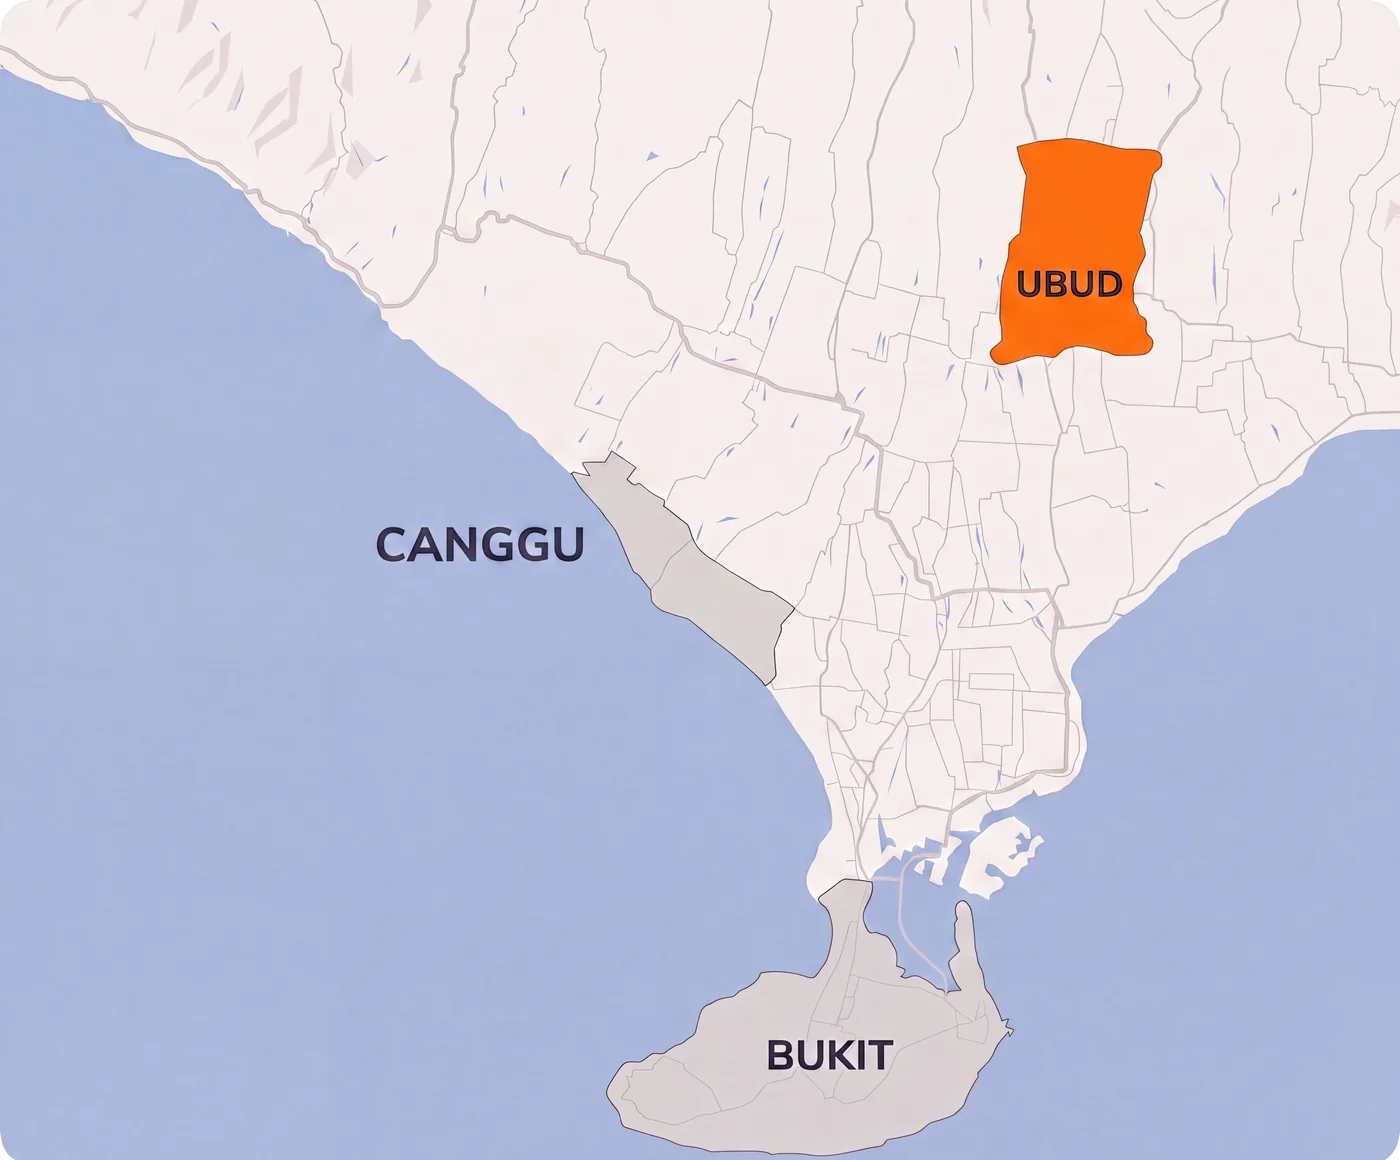
Ubud is the cultural and natural center of Bali. The district is known for its jungles, rice terraces and well-developed wellness infrastructure, which creates a unique type of demand. The flow of tourists here is more closely tied to retreats and eco-travel.
The district is also marked by a high share of specialized demand centered on wellness programs, yoga retreats, digital detox and cultural trips. Unlike the coastal districts, demand in Ubud depends far more on a property's concept, level of privacy and quality of service, which makes the market especially sensitive to product quality and positioning.
Ubud — the cultural and natural center in the island's interior
4.1. Supply growth in the Ubud district
Year
1br
2br
3br
4br
5br
6br+
All
2024
970
637
298
141
57
61
2,164
2025
1,381
882
408
174
84
91
3,020
Change
42.4%
38.5%
36.9%
23.4%
47.4%
49.2%
+39.6%
The number of active listings grew by 39.6% — from 2,164 in 2024 to 3,020 in 2025. Particularly notable is the increase in large villas (5–6 bedrooms), which reflects growing interest in formats for group trips, retreats and family stays. The rise in supply reflects both new project launches and properties built in earlier years still coming to market.
4.2. Occupancy in the Ubud district
Year
1br
2br
3br
4br
5br
6br+
All
2024
75.0%
74.6%
72.4%
69.7%
71.1%
62.3%
70.9%
2025
67.1%
65.7%
63.8%
62.2%
65.3%
59.3%
63.9%
Change
−7.9%
−9.0%
−8.6%
−7.6%
−5.8%
−3.0%
−7.0%
The average Occupancy figure fell by 7.0 percentage points — from 70.9% in 2024 to 63.9% in 2025. This is a sharper reaction to supply growth than in other districts, yet occupancy remains fairly high for the market. The decline is primarily linked to the rapid growth in the number of new properties and intensifying competition within the segment.
4.3. Actually occupied properties in the Ubud district
Year
1br
2br
3br
4br
5br
6br+
All
2024
727
475
216
98
41
38
1,595
2025
927
579
260
108
55
54
1,983
Change
27.5%
21.8%
20.7%
10.1%
35.4%
42.0%
+24.3%
The actual number of occupied properties increased by 24.3% — from 1,595 in 2024 to 1,983 in 2025.
This confirms the continued growth in overall tourist flow to the region and shows that, despite the drop in average occupancy, the total volume of stays keeps rising.
4.4. Market revenue in the Ubud district
Unit Type
2024
2025
Change
1br
$17.8M
$22.9M
28.3%
2br
$18.1M
$23.2M
27.9%
3br
$13.5M
$16.9M
25.3%
4br
$7.6M
$9.9M
30.6%
5br
$4.6M
$5.8M
24.3%
6br+
$4.7M
$7.6M
61.8%
Total
$66.4M
$86.3M
+29.9%
Ubud district revenue
USD million · 2024 → 2025 · the market is still far from saturation
$66.4
2024
$86.3
2025
Revenue
+29.9%
the market is far from saturation
Occupancy
−7.0 pp
reaction to supply growth
Total market revenue in the Ubud district grew by 29.9%. In 2024 the total market volume was around $66.4M, and in 2025 it reached $86.3M.
The dynamics are especially notable in the 6+ bedroom villa segment (+61.8%), which confirms the demand for organized group trips, retreats and large bookings.
The growth in revenue confirms sustained demand for specialized accommodation formats in the district.
4.5. Investment takeaway
Ubud is the only district in Bali where the natural setting, cultural context and tourist demand create a fundamentally different product. This is not merely an alternative location — it is a separate market with its own logic and its own audience, willing to pay for a unique living experience.
The district continues to attract tourists for whom the quality of the experience matters more than proximity to the beach. This demand is resilient, growing and barely overlaps with the audience of the coastal districts. Revenue grew by 29.9% — and that is despite the market still being far from saturation.
The investment window in Ubud remains open. Entry cost does not yet reflect the district's full potential, while demand for exclusive properties with a distinctive concept and a unique living experience continues to outpace supply. For an investor ready to create a product rather than merely a property, this is the most promising entry point on the island right now.
For a clear assessment of the districts' investment appeal, the summary table below shows the dynamics of the key performance indicators (2025 vs 2024). This block makes it possible to compare the key districts by supply growth rate, demand dynamics, occupancy level and total market revenue.
Bukit shows the highest revenue growth (+51.8%) with sustained demand. The district is uneven: the investment outcome here is determined by the precision of the location choice within it.
Canggu is the island's most mature and predictable market, with the highest absolute revenue ($194.6M). Demand resilience here is high, but entry cost has risen substantially over recent years.
Ubud forms a separate demand vector that does not compete with the coastal districts. Revenue growth of 29.9% combined with a still-affordable entry cost makes the district the most promising for a new investor with a product mindset.
Choosing a district is a choice of strategy, not of the 'best market'. Questions of entry cost and land rights (leasehold / freehold) directly affect yield — read more in the article 'Freehold or leasehold in Bali'.
Section 06 · Competition and efficiency
Competition and property efficiency in the Bali market
The rapid growth of supply in the short-term rental market substantially increases market density across all the island's key tourist districts. Over the past year the number of active listings in Bali increased by more than 35%, which led to a noticeable intensification of competitive pressure on accommodation properties.
Amid growing supply, the key success factor becomes not simply owning a property but its ability to meet modern quality standards and audience expectations. Properties with outdated design or weak management begin to show weaker results, while new, concept-driven projects maintain high efficiency.
Rising competition drives the further professionalization of the market. This is precisely why today the investment outcome is determined not by the choice of island but by the quality of the product itself — its concept, architecture and level of property management.
Property quality
Concept
A unique product concept is the foundation of efficiency in a mature market. Properties without a distinct idea lose demand to newer projects.
Key success factor
Visual appeal
Quality architecture and visual presentation directly affect bookings. Modern design sustains occupancy as competition grows.
Professional approach
Management
The level of operational management determines actual yield. Weak management lowers results even in a growing market.
Section 07
Key market takeaways
1
Steady growth amid rising competition
The Bali market continues to expand in both volume and monetary terms. Revenue growth of 31.4% confirms the island's continued high investment appeal.
2
A shift in focus toward quality
The era of entering the market without a distinct concept is over. In 2025, yield is secured through a unique concept, quality architecture and professional management.
3
Local specifics
Each district is a separate investment story. Bukit is compelling but requires a precise choice of location within the district. Canggu offers predictable cash flow, but not capital growth. Ubud remains a district with an open investment window for those who create a product.
4
A positive demand outlook
Despite the addition of new properties, the growth in the actual number of bookings (+30%) indicates that tourist demand in Bali continues to grow and supports the market's further expansion.
5
Market maturity
The current occupancy correction is a natural stage in the market's development and points to a transition toward a healthier and more predictable operating model.
The Bali market continues to develop. The data confirms it: demand is growing, the flow of tourists is increasing, and there are opportunities for the investor here.
But the market has become selective. Today the outcome is determined not by the overall trend but by the depth of understanding of a specific location, product and moment of entry.
This is exactly where analytics ends — and expertise begins.
FAQ
Frequently asked questions
Short answers on the Bali rental market — with figures from the BDA report.
How much did Bali's short-term rental market grow in 2025?
Total market revenue rose 31.4%, reaching $792M. The number of active listings on the island grew 35.9% — from 16,161 to 21,961 properties.
Which district showed the strongest growth?
The Bukit district shows the most pronounced growth dynamics: revenue grew 51.8% — from $92.6M to $140.6M — with a moderate occupancy decline of just 5 pp.
Why is occupancy falling if demand is growing?
Supply is growing faster than revenue, so occupancy corrects moderately. At the same time, the actual number of occupied properties increased by more than 30% — demand keeps growing and is spread across a larger number of properties.
Which district is more promising for a new investor?
Ubud forms a separate demand vector that does not compete with the coastal districts. Revenue growth of 29.9% combined with a still-affordable entry cost makes the district the most promising for a new investor with a product mindset.
Is Canggu a good investment right now?
Canggu is the island's largest and most predictable market ($194.6M in revenue, 61.8% occupancy), but entry cost has risen substantially. For a new investor it is a market of stable cash flow, not capital growth.
DT
Dmitrii Totoev
Founder of BDA (Bali Developers Accelerator). In real estate since 2012, with $350M+ in deals across four markets (Russia, Dubai, Turkey, Bali) and $50M+ in Bali. Yield calculations are built on a proprietary database of 30,000+ Bali properties (sources: AirDNA, management companies, direct owner reports). The methodology does not overstate yield or understate risk.
Data source: BDA analytical report 'Bali Short-Term Rental Market 2024–2025'. Published in 2026.
Want to choose the right district and property in Bali with precision?
BDA analyzes the market using a proprietary database of 30,000+ properties and calculates real yield by segment — from the choice of district and location to product concept and entry price.