Why investors undervalue Ubud — what the 2024–2025 data shows
In short
Ubud is the only one of Bali's key districts whose demand doesn't compete with the beach locations: it runs on wellness, retreats and cultural tourism. In 2024–2025, rental revenue here grew 29.9% — to $86.3M, and the number of occupied properties rose 24.3%. Investors undervalue the district because they read the dip in average occupancy as weakness, when it actually signals that new supply is being absorbed.
DTDmitrii Totoev, founder of BDAUpdated June 11, 2026
Over the year Ubud's short-term rental market grew 29.9% in revenue — from $66.4M to $86.3M. Supply increased 39.6% (from 2,164 to 3,020 active listings), the number of actually occupied properties rose 24.3% (from 1,595 to 1,983), and average occupancy stayed at a high level — 63.9%.
The growth spanned every villa format — from compact to large; demand is rising evenly rather than in a single narrow segment. This points to the market itself expanding, not a one-off spike in one category.
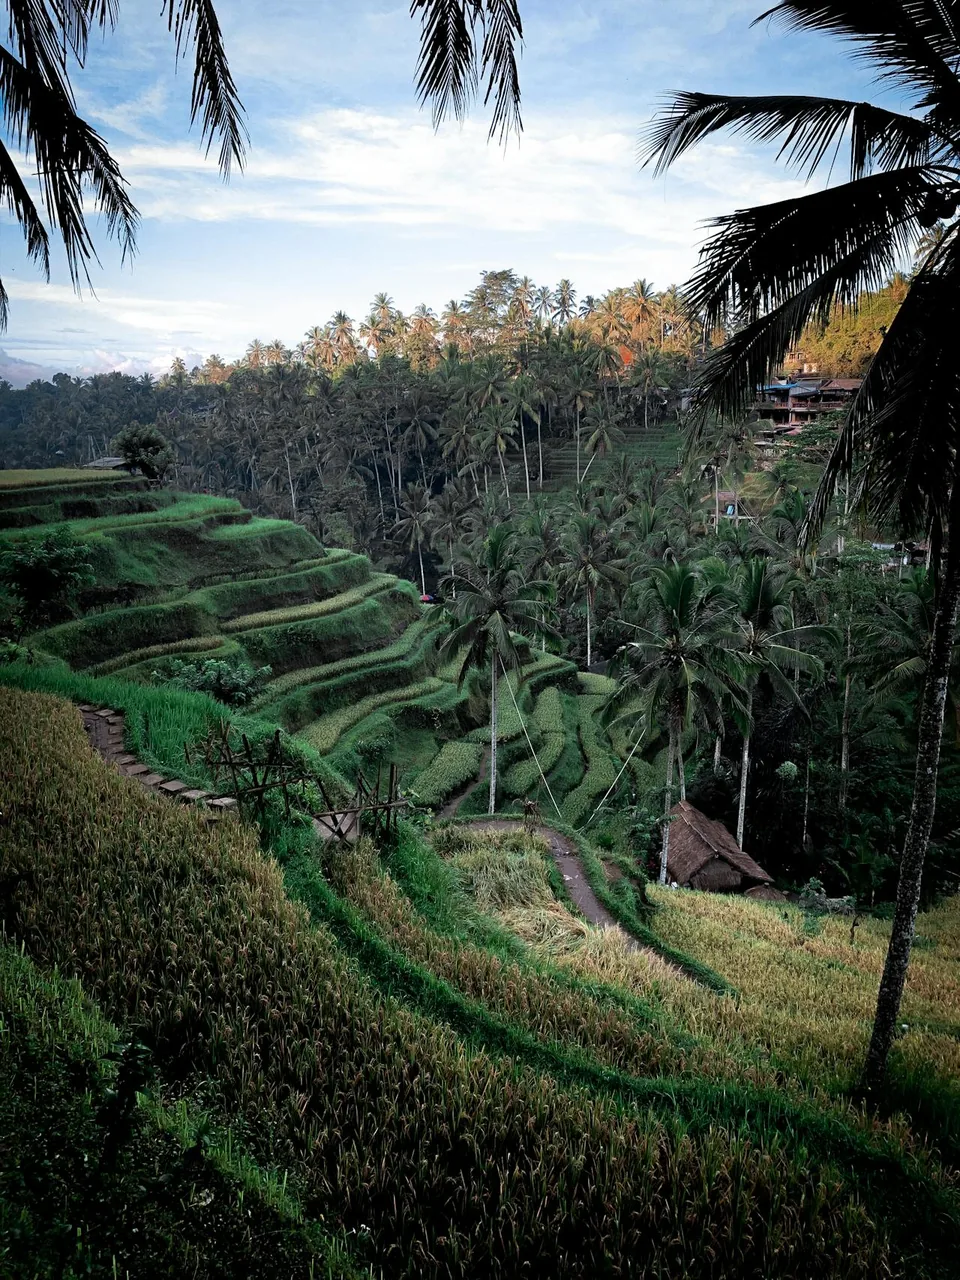
Ubud — the island's cultural and natural heart
Ubud · 2025
A market that is growing and absorbing new supply
$86.3M
Ubud rental market revenue in 2025
+29.9% year-on-year
3,020
active listings — 14% of all Bali supply
+39.6% year-on-year
1,983
actually occupied properties — real demand
+24.3% year-on-year
63.9%
average district occupancy — a high level amid rising supply
−7.0 pp year-on-year
Occupancy
Why is 63.9% average occupancy a strong indicator, not a weakness?
63.9% average occupancy is high for a district where supply grew almost 40% in a year. It is an average across Ubud's entire pool of properties: it includes both weakly and well-occupied villas, so for a quality, professionally managed product the real occupancy sits noticeably above average. The decline from 70.9% a year earlier is a mechanical effect of new villas coming online quickly, not a drop in demand.
The absolute numbers confirm this. Over the same year the number of occupied properties grew 24.3% and revenue grew 29.9%. There are more guests in Ubud — they have simply spread across more villas. Falling average occupancy alongside rising revenue and a rising number of occupied properties is the mark of a market expanding to absorb new supply, not one that is contracting.
The market is absorbing new supply
Ubud · growth for 2024 → 2025
Supply (listings)+39.6%
Market revenue+29.9%
Occupied properties (demand)+24.3%
Supply is growing fastest — so average occupancy declines mechanically. But both revenue and the number of occupied properties keep rising.
The misreading of the data here is typical: an investor sees "occupancy fell" and concludes the market is weak. In reality 63.9% is a strong average for a growing district, and the dip is simply the arithmetic of supply outpacing new guests over the same period. Absolute demand rose.
Why the average misleads
Why does the district average figure mislead investors?
A view-driven, concept property performs differently from a generic one
Ubud's average yield blends properties that aren't comparable — and so understates the potential of a quality product. Within the district the result depends heavily on concept, privacy, level of service and — especially in Ubud — the property's view. Demand here is tied to retreats, wellness and cultural tourism, not proximity to the beach: the guest pays for the experience and the setting, not the square footage.
Ubud has a rare concentration of view locations. A view of the jungle, mountains, canyon or rice terraces can be found here even within walking distance of the center. By BDA's calculations, view properties perform noticeably better than generic ones — and it is exactly this gap that the district average hides. An investor who relies on "the average yield for Ubud" is comparing villas that behave in completely different ways in the market.
In Ubud the view is not a nice extra but part of the product the guest pays for. So averaging a view-driven and a generic property into one "district average yield" means comparing fundamentally different business models.
District comparison
How does demand in Ubud differ from Canggu and Bukit?
Ubud draws a separate stream of demand that barely overlaps with the coastal districts. Canggu and Bukit compete for one audience — guests who value proximity to the beach and surf. Ubud serves those for whom the quality of the experience matters more than the sea: retreats, wellness, culture. This demand is resilient, growing, and follows its own pricing logic.
Behind the numbers in the table sit different investment logics. Bukit is a fast-growing but uneven market, where the result comes down to how precisely you pick a location within the district. Canggu is the island's most mature market, with the largest absolute revenue ($194.6M) but a high entry cost. Ubud is a separate market with its own audience, still far from saturation.
The island's sharpest momentum: revenue +51.8% (to $140.6M). But Bukit is not a single market: within the district, prices and demand vary by location, and the result depends on how precisely you pick the spot.
The largest and most predictable market: $194.6M in revenue (+33.9%) with stable occupancy of 61.8%. Demand is reliable, but the entry price is already high — the district delivers stable rental income rather than asset value growth.
Up 29.9% (to $86.3M) and still far from saturation. A separate wellness market that barely overlaps with the coast: the entry price is still below the district's potential, and demand for villas with a strong concept and view outpaces supply.
2025 revenue$86.3M
Ubud is not "weaker" than the coast. It is a different market with a different audience, and comparing it with Canggu on average yield means measuring different things with the same ruler.
Cycle stage
Why is Ubud more interesting than mature Canggu for a new investor?
Ubud is at an earlier stage of the market cycle than Canggu — and that is its key advantage for entering now. The entry cost here has not yet caught up with the district's potential, and demand for properties with a distinct concept continues to outpace supply.
The contrast with Canggu is telling. Canggu has already passed its phase of value growth: at $194.6M in revenue and stable occupancy of 61.8%, it is a market of predictable cash flow, not capital growth — those who entered earlier have already locked in their gains. Ubud combines cash flow with the potential for asset value growth. The entry window here has not yet closed — and for an investor ready to create a product rather than simply buy a property, this is one of the most promising entry points on the island today.
Early market stage: the entry price in Ubud is still below its potential
Risks
What risks should an investor in Ubud consider?
Ubud carries real risks, and the district averages do not erase them. Here are the three main ones — honestly.
Risk 1
Rising competition
Supply grew 39.6% in a year — faster than revenue. The market is getting denser, and the pressure falls above all on generic properties. The days of entering without a distinct concept are over.
Risk 2
Dependence on the product
Demand in Ubud is tied to concept, privacy, service and view. That is a plus for a strong view-driven product and a risk for a generic one: a weak property falls behind more visibly here than in the beach districts.
Risk 3
Land rights
This is outside the scope of the report, but critical for any deal in Bali: land-rights questions (leasehold/freehold, rights conversion) can block a project and require separate due diligence.
The key caveat: the figures in this article describe the market's dynamics per the report's data, not absolute indicators for all of Bali. An investment decision rests not on the district average, but on the specific location, product and timing of entry.
Conclusion
Ubud is undervalued not because it is weaker. But because it is misread
Ubud's rental revenue grew 29.9% to $86.3M, the number of occupied properties rose 24.3%, and average occupancy stayed high — 63.9%. This is a separate wellness market with its own audience, still far from saturation.
Investors undervalue the district because they judge it by the yardstick of the coast: they see a decline in average occupancy and more modest revenue growth — and walk past. But in Ubud the result is driven by the view, the concept and the timing of entry, not the district average. This is exactly where analytics ends — and expertise begins.
FAQ
Frequently asked questions
Short answers about investing in Ubud — with figures from the BDA report.
How much did the Ubud rental market grow in 2025?
According to the BDA report, total short-term rental revenue in Ubud grew 29.9% — from $66.4M in 2024 to $86.3M in 2025. The number of active listings rose 39.6%.
Occupancy in Ubud dropped — is that a bad signal?
No. Average occupancy stayed at a high level of 63.9%, and this is an averaged figure across the whole district — it includes both weakly and well-occupied properties. The decline from 70.9% is due to the rapid arrival of new supply (+39.6%), while the number of actually occupied properties grew 24.3% — demand kept rising.
Ubud or Canggu — which should an investor choose?
Canggu is a mature market of predictable cash flow, but with a high entry cost and no pronounced capital growth. Ubud is an earlier stage of the cycle: cash flow plus the potential for asset value growth. The choice depends on the investor's goal.
Where in Ubud should you look for a high-yield property?
What matters is not so much the specific address as the view characteristics and concept of the property. Ubud is rich in view locations — jungle, mountains, canyon, rice terraces are available even near the center — and by BDA's calculations view properties perform noticeably better than generic ones.
Can you achieve above-average yield in Ubud?
Yes. Average figures blend strong and weak properties. An above-average result is achieved through concept, view, architecture and professional management — in Ubud these factors influence yield more strongly than in the beach districts.
DT
Dmitrii Totoev
Founder of BDA (Bali Developers Accelerator). In real estate since 2012, $350M+ in deals across four markets (Russia, Dubai, Turkey, Bali), $50M+ in Bali. Yield calculations are built on a proprietary database of 30,000+ Bali properties (sources: AirDNA, management companies, direct owner reports). The methodology does not inflate yield or understate risk.
BDA analyzes the market using a proprietary database of 30,000+ properties and calculates real yield by segment — from choosing a view location in Ubud to the product concept and entry price.