Canggu 2025: a strong market ≠ a profitable investment

Analytics · BDA · Canggu district · 2024 → 2025

Canggu in 2025: why a strong market isn't always a good investment?

In short Canggu is Bali's largest short-term rental market: turnover of $194.6M in 2025 (+33.9% versus 2024) and the most resilient occupancy among top districts — 61.8%. But for a new investor the market's strength has turned into a high entry price. Canggu today delivers steady cash flow, not capital growth: the district's investment window has largely closed.
DTDmitrii Totoev, founder of BDA Updated 10 June 2026

Scale

How big is the Canggu market in 2025?

Canggu is the largest short-term rental market in Bali. In 2025 the district had 4,746 active listings — about 22% of the island's entire supply and more than in Bukit (3,593) or Ubud (3,020). Combined turnover reached $194.6M versus $145.4M a year earlier — a 33.9% rise.

In absolute terms it is the island's largest district: Canggu accounts for roughly a quarter of Bali's entire market turnover ($194.6M out of $792M, BDA calculation based on report data). For comparison, Bukit's turnover is $140.6M and Ubud's is $86.3M.

Canggu is a broad cluster: in the report it spans locations from Umalas to Nuanu. It is not a classic resort but an established hub of expat and tourist life, which generates year-round demand rather than high-season demand alone.

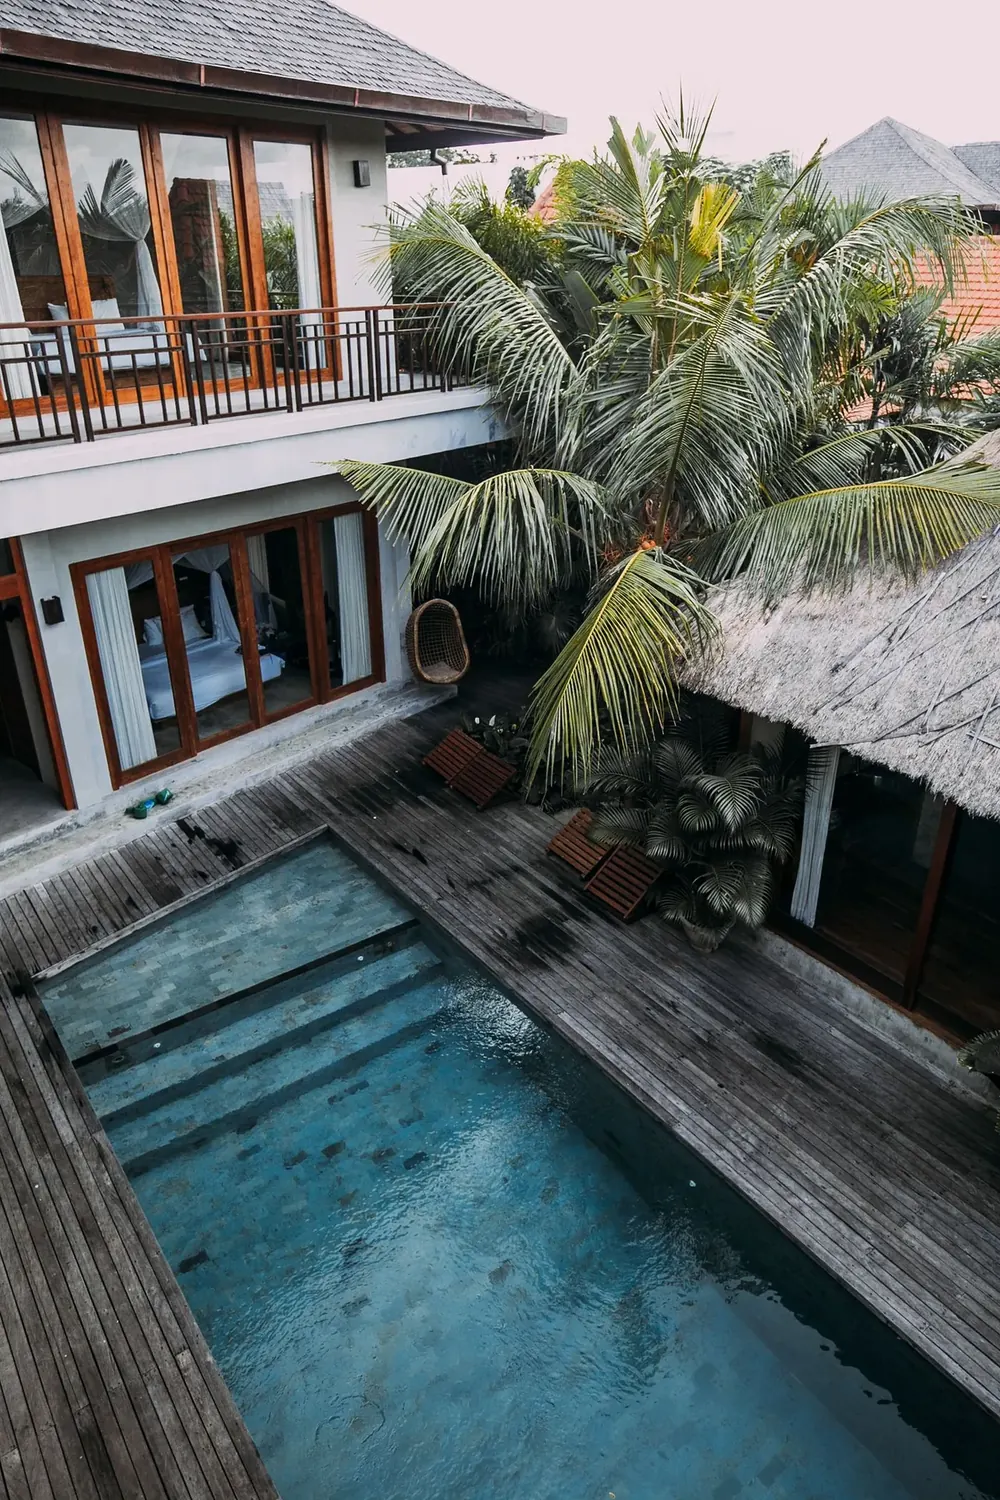
Modern Balinese villa with a pool and alang-alang roof among palm trees, Canggu district
Canggu — the island's hub of expat and tourist life

Canggu · 2025

The island's largest and most resilient rental market

$194.6M
Canggu rental market turnover in 2025 — about a quarter of the whole island
+33.9% year on year
61.8%
average occupancy — the most moderate decline among top districts
−4.5 pp year on year
4,746
active listings — 22% of Bali's entire supply
+32.4% year on year

The core thesis

If the market is this strong, what's the problem for an investor?

Canggu's strength has become its main limitation — maturity. Several years of strong interest in the district have driven a substantial rise in the cost of entry, for both land and finished properties. At today's prices, the ratio of entry price to potential yield keeps getting less attractive for anyone entering now.

This is exactly where the difference between a strong market and a good investment lies. High turnover and steady demand are characteristics of the market, not of your deal. An investor's yield is determined not by the size of the market but by the price at which they entered it. Those who bought land and property in Canggu earlier have already locked in capital growth. The new investor is left with steady cash flow at a high entry price.

This is the typical logic of a mature market: demand becomes more predictable, the risk premium falls, and with it the potential for asset appreciation. Canggu has moved past the phase in which most of the profit came from rising land value.

Strong market — weak entry point
Canggu, 2025 · what's growing and what's shrinking
Market turnover
$194.6M
growing, +33.9%
Capital-growth window
shrinking
entry price already high
Canggu's cash flow is strong. Its potential for asset appreciation is limited.

Demand

Why has occupancy fallen, yet it isn't a sign of weakness?

Occupancy in Canggu fell by just 4.5 percentage points — from 66.3% in 2024 to 61.8% in 2025. This is the smallest drop among the three top districts (Bukit −4.9 pp, Ubud −7.0 pp) and a sign of resilience, not weakness in demand.

The mechanics are simple. Supply in the district grew by 32.4% (from 3,584 to 4,746 listings), while the number of occupied properties grew by 23.9% (from 2,490 to 3,084). Demand grew more slowly than supply, so average occupancy declined. But absolute demand kept rising: the market absorbed almost 600 new operating properties in a single year.

Supply grows faster than demand
Canggu · growth over 2024 → 2025
Market turnover+33.9%
Supply (listings)+32.4%
Occupied properties (demand)+23.9%
What's more, revenue per occupied property has also risen. By BDA's calculation on the report's data, gross revenue per occupied property rose from ≈$58.4K in 2024 to ≈$63.1K in 2025 (+8%). The market grew not only through new properties but through higher revenue per operating one — demand in Canggu is real and backed by spending power.

District comparison

Canggu versus Bukit and Ubud — where's the income and where's the value growth?

Canggu delivers steady rental income, but asset appreciation there is already limited. Comparing how the three districts moved through 2025 shows which one suits which investor.

Canggu is the island's largest and most predictable market, but its growth is the most stable, not the fastest. Bukit grew the most in turnover (+51.8%), yet the market there is uneven: the result depends on how precisely you pick the location within the district.

Ubud, with +29.9% growth, remains the most undervalued district: the entry price hasn't yet caught up with its potential, and demand for strong properties outpaces supply. If you need steady rental income in a mature market, Canggu is the logical choice. If asset appreciation matters more, there is more potential today in Ubud and in select Bukit locations.

Market turnover by district
2025 · USD M
$140.6
Bukit
$194.6
Canggu
$86.3
Ubud
Metric (2025 vs 2024)BukitCangguUbud
Supply growth (Listings)+54.9%+32.4%+39.6%
Occupancy change (Occupancy)−4.9 pp−4.5 pp−7.0 pp
Growth in occupied properties (demand)+45.0%+23.9%+24.3%
Turnover growth (Total Revenue)+51.8%+33.9%+29.9%
Market turnover 2025, abs.$140.6M$194.6M$86.3M

Source: BDA analytical report «Bali Short-Term Rental Market 2024–2025».

Fast growth, but an uneven market

The island's most pronounced growth: turnover +51.8% (up to $140.6M). But Bukit is not a single market: within the district, locations vary widely in price and demand, and the result depends on how precisely you pick the specific spot.

Bukit — separate analysis
Turnover 2025$140.6M
Steady income, but expensive entry

The largest and most predictable market: $194.6M in turnover (+33.9%) with steady occupancy of 61.8%. Demand is reliable, but the entry price is already high — the district delivers steady rental income, not asset appreciation.

Turnover 2025$194.6M
The most promising entry right now

Growing at 29.9% (up to $86.3M) while still far from saturation. A distinct wellness market, barely overlapping with the coast: the entry price is still below the district's potential, and demand for villas with a strong concept outpaces supply. Today this is the most promising entry on the island.

Ubud — separate analysis
Turnover 2025$86.3M

There is no «profitable» district in a vacuum — there is a match between the district and the investor's goal. For steady income it's Canggu; for value growth today it's Ubud. We break down Bukit and Ubud in separate pieces.

Strategy

What does Canggu's strength mean for an investor's strategy in 2025?

In a mature market, yield comes from the quality of the property, not from the overall trend. Across the island as a whole, supply grew by 35.9% and turnover by 31.4%: supply is growing faster than the money, and the gap between strong and weak properties is widening.

Factor 1

Concept

In Canggu's mass-market 2–3BR segment, competition is at its peak. «Just a villa in a popular district» at market price competes on price alone — and that destroys yield.

Factor 2

Architecture

Well-conceived new villas hold high occupancy and rate, while properties with dated design are the first to slip. The district's high turnover is the sum of very different properties.

Factor 3

Management

District averages hide the real picture. Professional management changes the financial result more than the choice between one location and the next within Canggu.

The practical takeaway for Canggu: it makes sense to enter the district only with a property that beats the competition on concept, architecture and management — and at an entry price that leaves room for yield. BDA calculates yield not from headline rates but from per-segment comp sets drawn from its own database of 30,000+ properties, modeling occupancy, revenue and entry price separately.

Revenue and yield

Why is average district revenue not yet the investor's yield?

A villa's average revenue and the investor's yield are two different things. The figures below are gross revenue — all the money guests pay for the rental. The investor's yield is noticeably lower: from that revenue you subtract operating expenses — management, maintenance, a renovation reserve, often around half the total — and only then compare the result with the entry price.

Villa revenue in Canggu depends on size: from ≈$22K a year for one-bedroom properties to ≈$115K for large villas with 6+ bedrooms. This is an average across all villas in the segment — the well-performing and the poorly occupied alike.

Villa typeListingsSegment turnoverAverage revenue per villa*
1 bedroom931$20.9M≈ $22K/year
2 bedrooms1,447$42.1M≈ $29K/year
3 bedrooms1,433$57.5M≈ $40K/year
4 bedrooms483$27.5M≈ $57K/year
5 bedrooms210$18.7M≈ $89K/year
6+ bedrooms242$27.9M≈ $115K/year
Total4,746$194.6M

*Average gross revenue = segment turnover ÷ all villas of that type (Canggu, 2025). This is revenue before expenses, not the investor's yield.

And most important of all — yield depends on the entry price, and in Canggu that price has risen the most. So even with healthy revenue the new investor's yield shrinks, and the headline «20% a year» simply doesn't apply to Canggu in 2025: real yield has to be calculated for each villa separately.

Conclusion

A strong market is a market. A good investment is a deal

Canggu remains the largest and most recognizable short-term rental market in Bali: $194.6M in turnover and steady occupancy of 61.8% confirm the resilience of demand. The district is established, the infrastructure is developed, and the tourist flow is predictable.

But it is precisely this maturity that defines the key limitation. Those who entered earlier locked in capital growth. For the new investor, Canggu is a market of steady cash flow, but not of asset appreciation. The result today is determined not by the market's strength, but by the entry price, the product and the timing of the deal.

FAQ

Frequently asked questions

Short answers to questions about investing in Canggu — with figures from the report.

Is it worth buying a villa in Canggu in 2025?
Canggu suits an investor who needs steady cash flow in a mature, predictable market. For capital growth the district is less appealing: the entry price is already high, and the main growth in land value happened in earlier years. A purchase is justified only for a property with a strong concept and at an entry price that leaves room for yield.
What is villa occupancy in Canggu?
In 2025 average occupancy in Canggu was 61.8% — a 4.5 pp drop versus 2024 (66.3%). This is the most moderate decline among the island's top districts and a sign of resilient demand against a 32.4% rise in supply.
Which Bali district is more profitable to invest in — Canggu, Bukit or Ubud?
It depends on the goal. Canggu is the largest market ($194.6M turnover) for steady rental income. Bukit grew the most in turnover (+51.8%), but the market is uneven and requires precise location selection. Ubud (+29.9%) is the most promising entry right now: the entry price is still below the district's potential. There is no «profitable» district in a vacuum — there is a match between the district and the investor's goal.
Why doesn't high market turnover guarantee high yield?
Turnover is a characteristic of the market, and yield is a characteristic of a specific deal. Canggu's large turnover means strong demand, but not a low entry price. In a mature market the asset price already includes growth expectations, so a new investor buys expensively and gets less yield potential than those who entered earlier.
Is Canggu about capital growth or cash flow?
Cash flow. Demand is stable and predictable, occupancy holds around 62%, turnover is rising. But the phase of rapid growth in land value in Canggu is largely over, so the capital-appreciation potential is lower than in districts with an earlier entry point.
DT
Dmitrii Totoev

Founder of BDA (Bali Developers Accelerator). In real estate since 2012, $350M+ in deals across four markets (Russia, Dubai, Turkey, Bali), $50M+ in Bali. Yield calculations are built on a proprietary database of 30,000+ Bali properties (sources: AirDNA, management companies, direct owner reports). The methodology does not overstate yield or understate risk.

Market data source: BDA analytical report «Bali Short-Term Rental Market 2024–2025».
Last updated: 10 June 2026

A strong market is not yet your yield

BDA analyzes the market using its own database of 30,000+ properties and calculates real yield by segment — from the choice of location in Canggu to the product and the entry price.

Contact BDA